Wow! August of 2020 was a "barn burner"! August is usually a sleeper month when many buyers and sellers are on vacation before the school year starts up again. We noticed a short lull of activity at the beginning of August but the rest of the month made up for it.

Increased buyer activity creates upward pressure on prices in REBGV
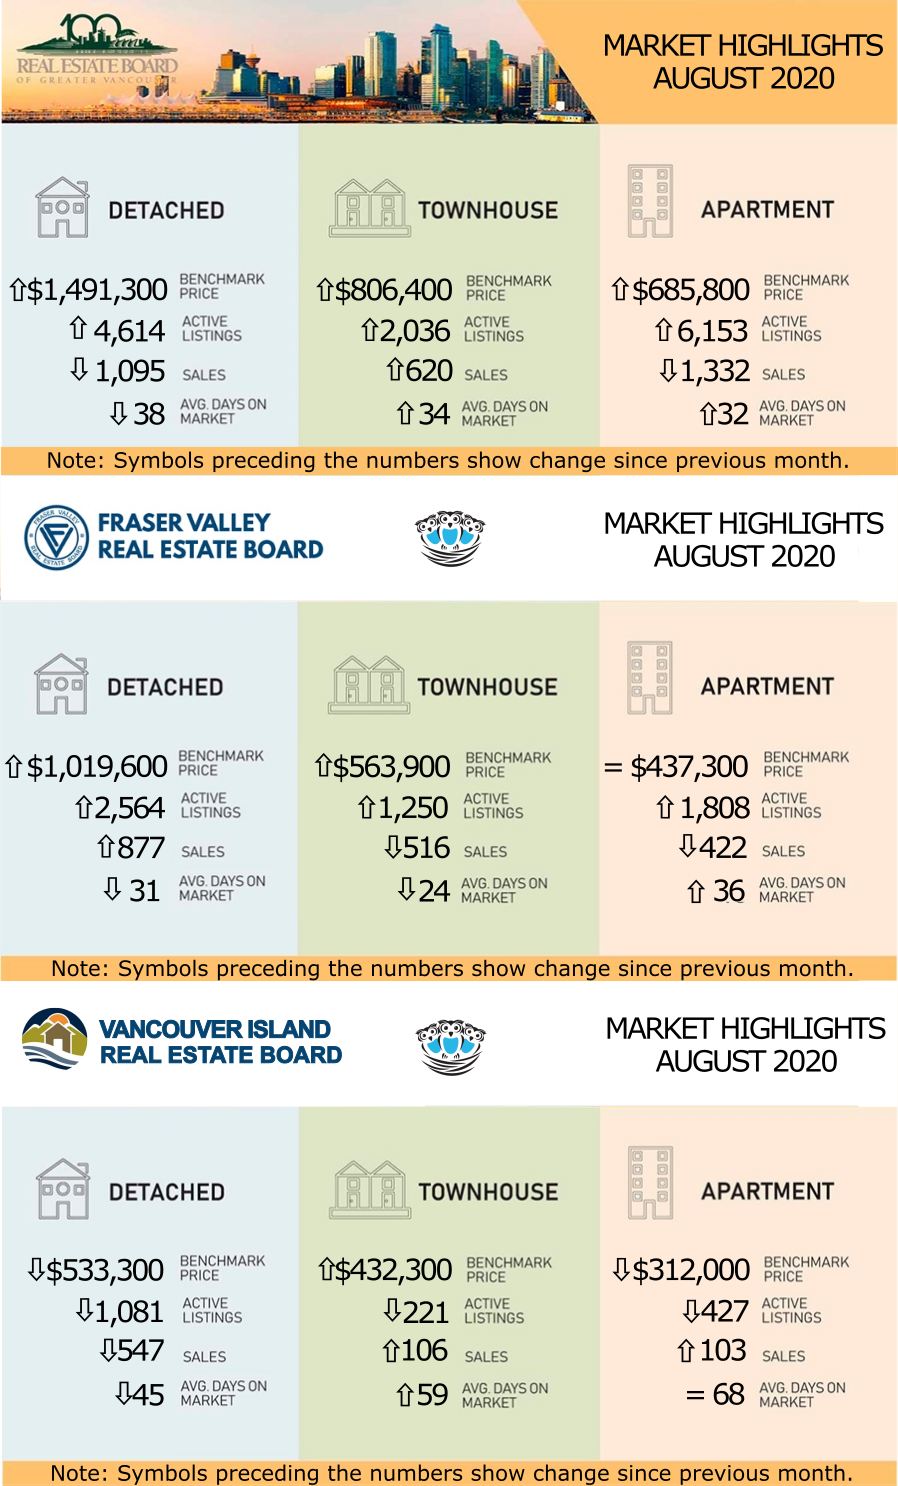
"The Real Estate Board of Greater Vancouver (REBGV) reports that residential home sales in the region totalled 3,047 in August 2020, a 36.6 percent increase from the 2,231 sales recorded in August 2019, and a 2.6 percent decrease from the 3,128 homes sold in July 2020.
Sales and New Listings set records in the Fraser Valley
A total of 547 single-family detached properties (excluding acreage and waterfront) sold in August, a year-over-year increase of 35 percent. Sales of condo apartments rose by 43 percent year over year while row/townhouse sales increased by 19 percent.
Active listings of single-family detached properties (excluding acreage and waterfront) totalled 1,081 in August, while there were 427 condo apartments and 221 row/townhouses for sale last month."
“Our housing market rebounded from the COVID-19 downturn far more quickly than expected,” says VIREB president Kevin Reid. “Pent-up demand, low-interest rates, and persistent supply shortages are fueling the recovery.”
The Stats Centre Reports for the REBGV for August are available now on our website at this link under the "BLOG AND STATS" heading. They are automatically updated every month on our website as they become available. LINK
Note that you may have to refresh the screen a few times until all the reports come up. This is a problem with the Real Estate Board website.
Here are the full statistic packages for Greater Vancouver, the Fraser Valley (which includes Surrey, North Surrey, South Surrey/White Rock, Cloverdale, Delta, Langley, Abbotsford, Chilliwack, and Mission), and Vancouver Island (which includes Campbell River, Comox, Duncan, Nanaimo, Parksville/Qualicum, and Port Alberni.)
Below is a link to a graph showing the rise in prices in the Lower Mainland just for resale properties (no new homes) over the last year. This link is live so it will update when the new statistics come in each month. LINK to live graph
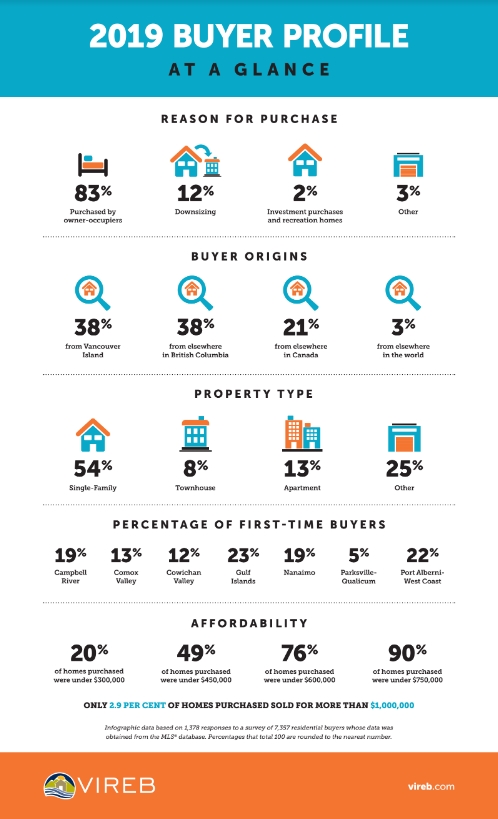
Vancouver Island Buyer Infographic - Click the image below for a full-sized PDF in a new window.

