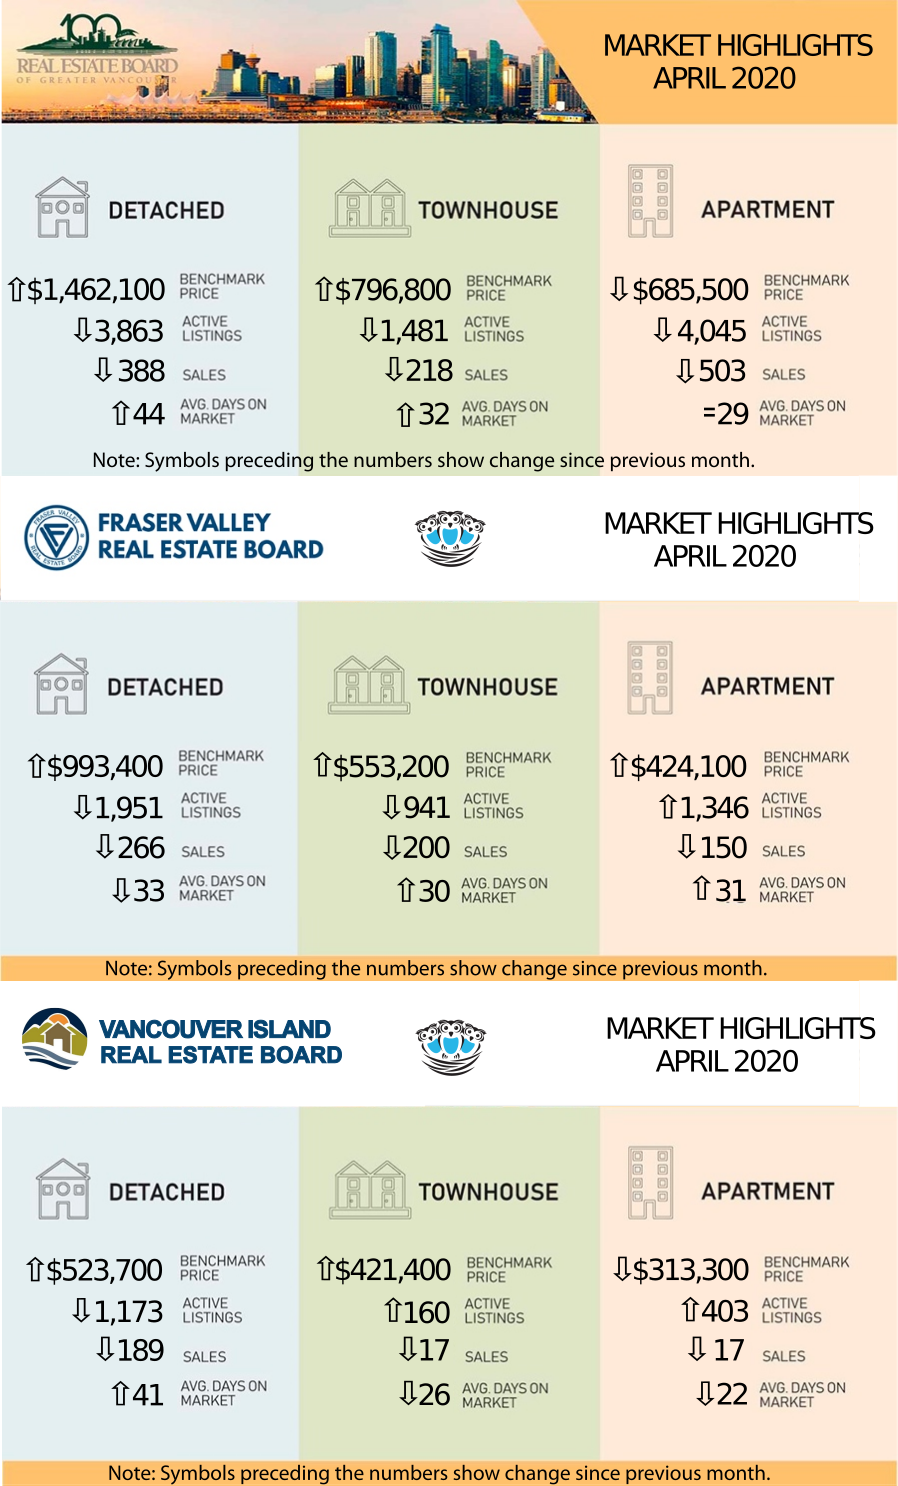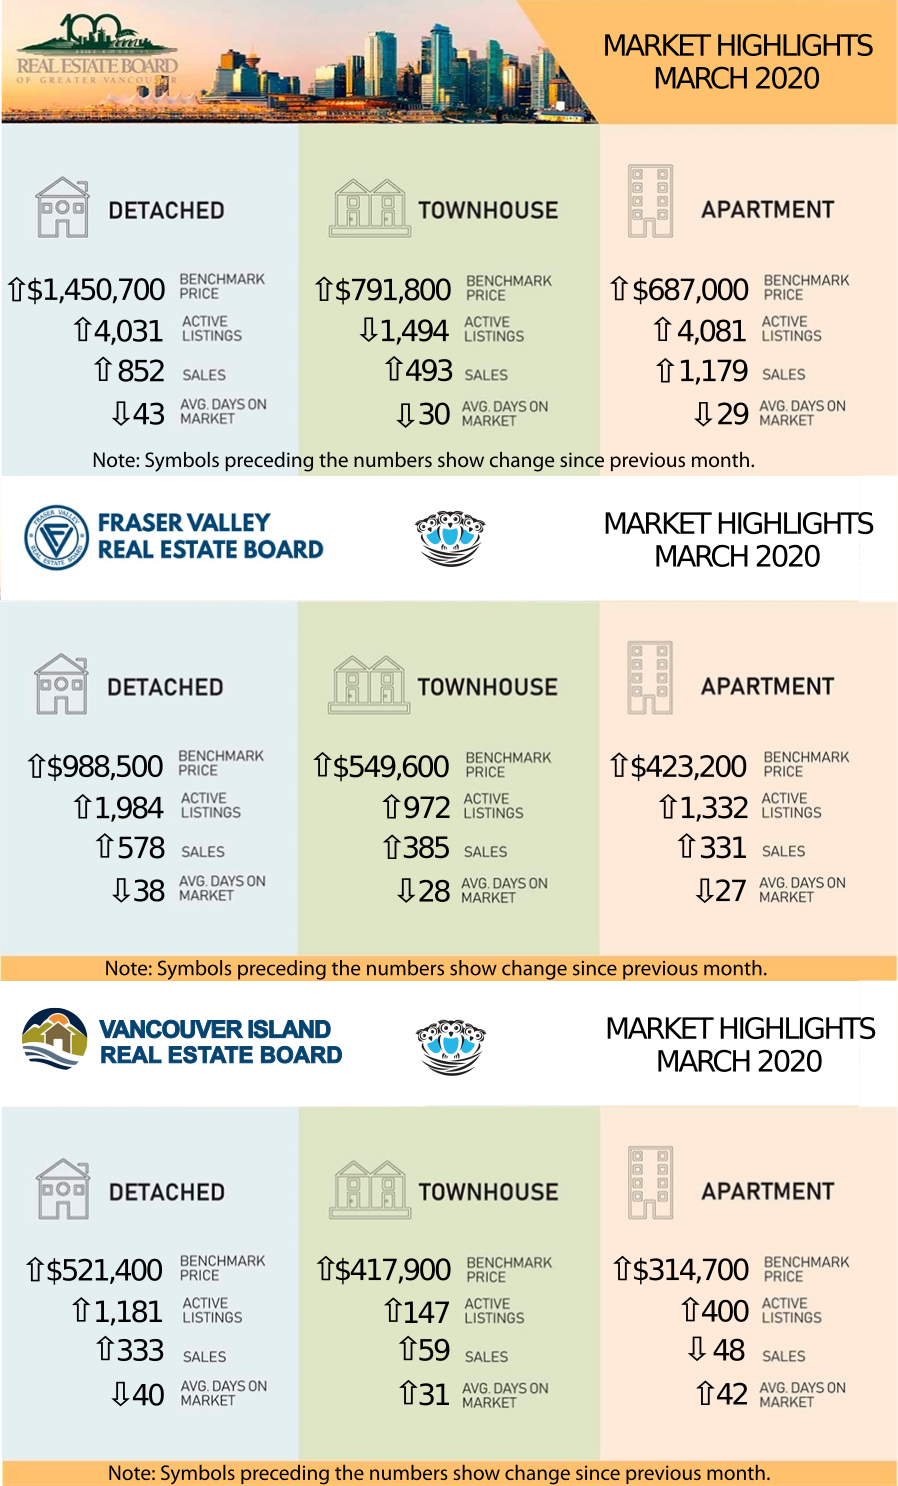
Our apologies for missing last month's statistics. You can find the infographics for March at the bottom of this email.
The change in the market was notable after the first week of March when the steady home buyer demand started to level off over the concerns about COVID-19. Now, with another month behind us, there is no surprise that with the COVID-19 situation both the activity and the real estate sales have been drastically reduced in April 2020.
Residential home sales in Metro Vancouver dropped by 56.1% from the previous month and totalled 1,109 for April 2020. April sales were 62.7 percent below the 10-year April sales average and were the lowest total for the month since 1982. (When interest rates were over 20%!)
A similar trend is present in the low number of new listings as sellers are reluctant to list their properties. In April, there were 2,312 new listings for all types of residential properties in the REBGV. This is a 59.7 percent decrease from April 2019 and a 47.9 percent decrease from last month.
For all property types, the sales-to-active listings ratio for April 2020 is 11.8 percent. By property type, the ratio is 10 percent for detached homes, 14.7 percent for townhomes, and 12.4 percent for apartments. This is a sharp change from the relatively unaware of Covid month of February where the numbers were 23.4 percent overall. By property type, the ratio was 17.3 percent for detached homes, 26.9 percent for townhomes, and 28.4 percent for apartments.
At the same time, the benchmark prices for all residential properties in Metro Vancouver experienced a slight increase of 0.2 percent compared to last month across all property types.
The Stats Centre Reports for the REBGV for March are available now on our website at this link under "BLOG AND STATS" . April will be added in a few days. The Stats Centre Reports are automatically updated every month on our website as they become available. LINK
Note that you may have to refresh the screen a few times until all the reports come up. This is a problem with the Real Estate Board website.
Here are the full statistic packages for Greater Vancouver, the Fraser Valley (which includes Surrey, North Surrey, South Surrey/White Rock, Cloverdale, Delta, Langley, Abbotsford, Chilliwack, and Mission), and Vancouver Island (which includes Campbell River, Comox, Duncan, Nanaimo, Parksville/Qualicum, and Port Alberni.)
Below is a link to a graph showing the rise in prices in the Lower Mainland just for resale properties (no new homes) over the last year. This link is live so it will update when the new statistics come in each month. LINK to live graph
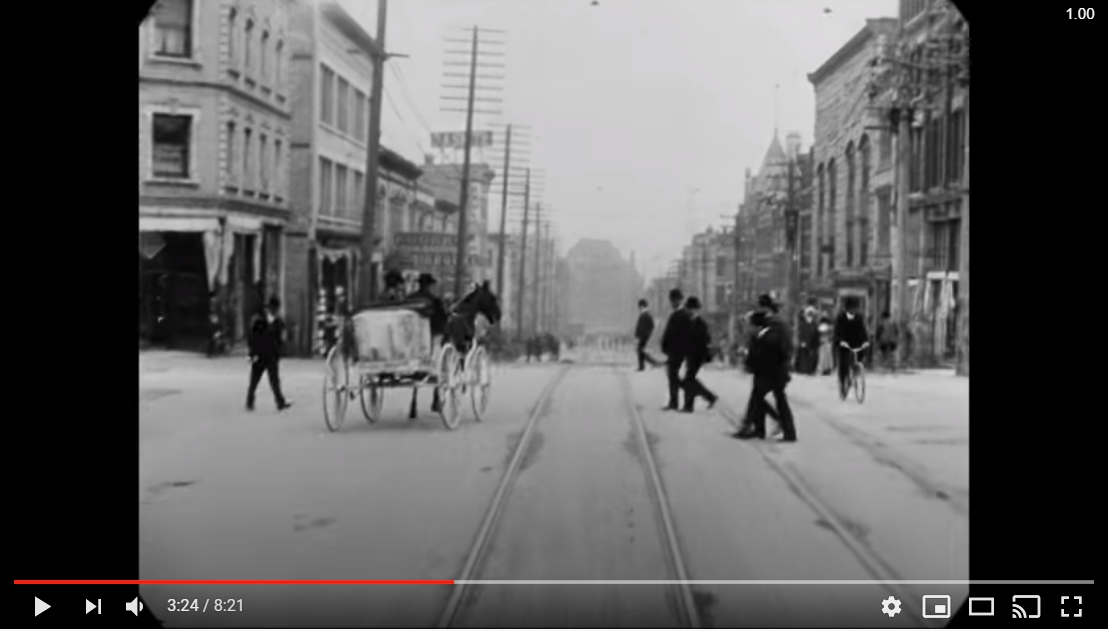
Once Covid is over we'll all be like this: (Click on the video below.)
Featured Video of the Month - Vancouver/Victoria in 1907 - Video (The original film was shot by William Harbeck who tragically died on the Titanic.):
From the Vancouver History Website: vancouverhistory.ca
"The Vancouver of 1907 was a thriving, energetic city. The population was climbing rapidly, jumping from 27,000 in the 1901 census to the 70,000 of 1907. We can actually see the city’s vitality thanks to a man named William Harbeck who set up a film camera at the front of a BC Electric Railway streetcar and on May 7 filmed the city’s downtown streets.
(Click on the image below for the video to open in a new window.)

We wish everyone continued good health through these difficult times.
Cheers,
Barry, Olga, and Alice


#6-228 Schoolhouse Street, Coquitlam, BC, V3K 6V7

