There has been a lot going on in world news and the local real estate market. It's a lot to take in for the average Lower Mainlander and I think we are all still struggling with the effect it will have on our health, our extended families and friends, our livelihoods, our investments, and the overall economy.
Hopefully, everyone is stocked up with a supply of their basic foodstuffs. Whether or not you think that this virus' risk is overblown or not, it's important to be at least as ready as the rest of the population as the supply of certain items will assuredly be reduced if we get into an outbreak like many other countries are experiencing. We are still near the beginning of the curve.
We've already instituted a no-handshaking protocol at showings. Our clients are getting used to the "elbow donk" when greeting us and other realtors at property showings. :^)
Paradoxically, we are seeing increased activity at recent Open Houses. There seems to be a big increase over the last month in the number of potential buyers. The most likely drivers of this activity are:
1) The relaxation of the mortgage stress test rules.
2) Large drops in the overnight bank rate. (2 x 50 basis points = 1.00%)
3) Pent-up demand.
4) Lack of listings.
5) Money fleeing the stock markets.
6) Vancouver being seen as a safe(r) haven from Covid-19?
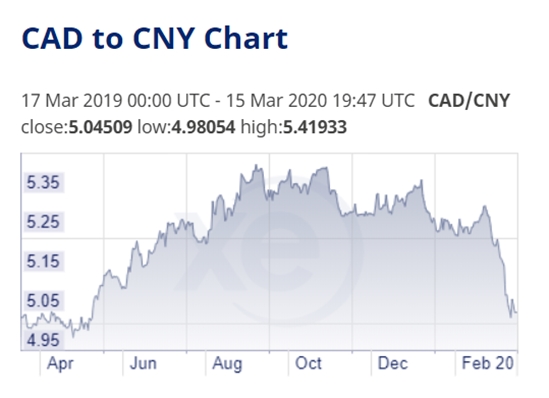
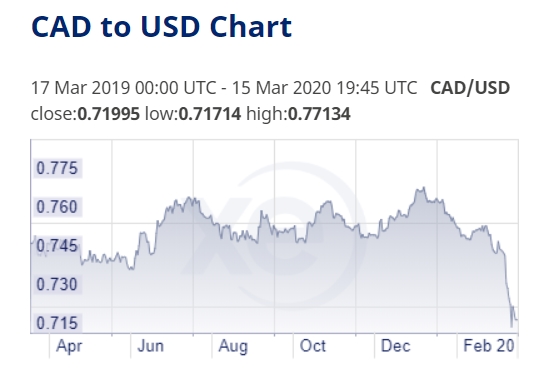
7) The drop in the Canadian dollar vs other currencies which makes our real estate even "cheaper".
From the Greater Vancouver Real Estate Board's February Statistics:
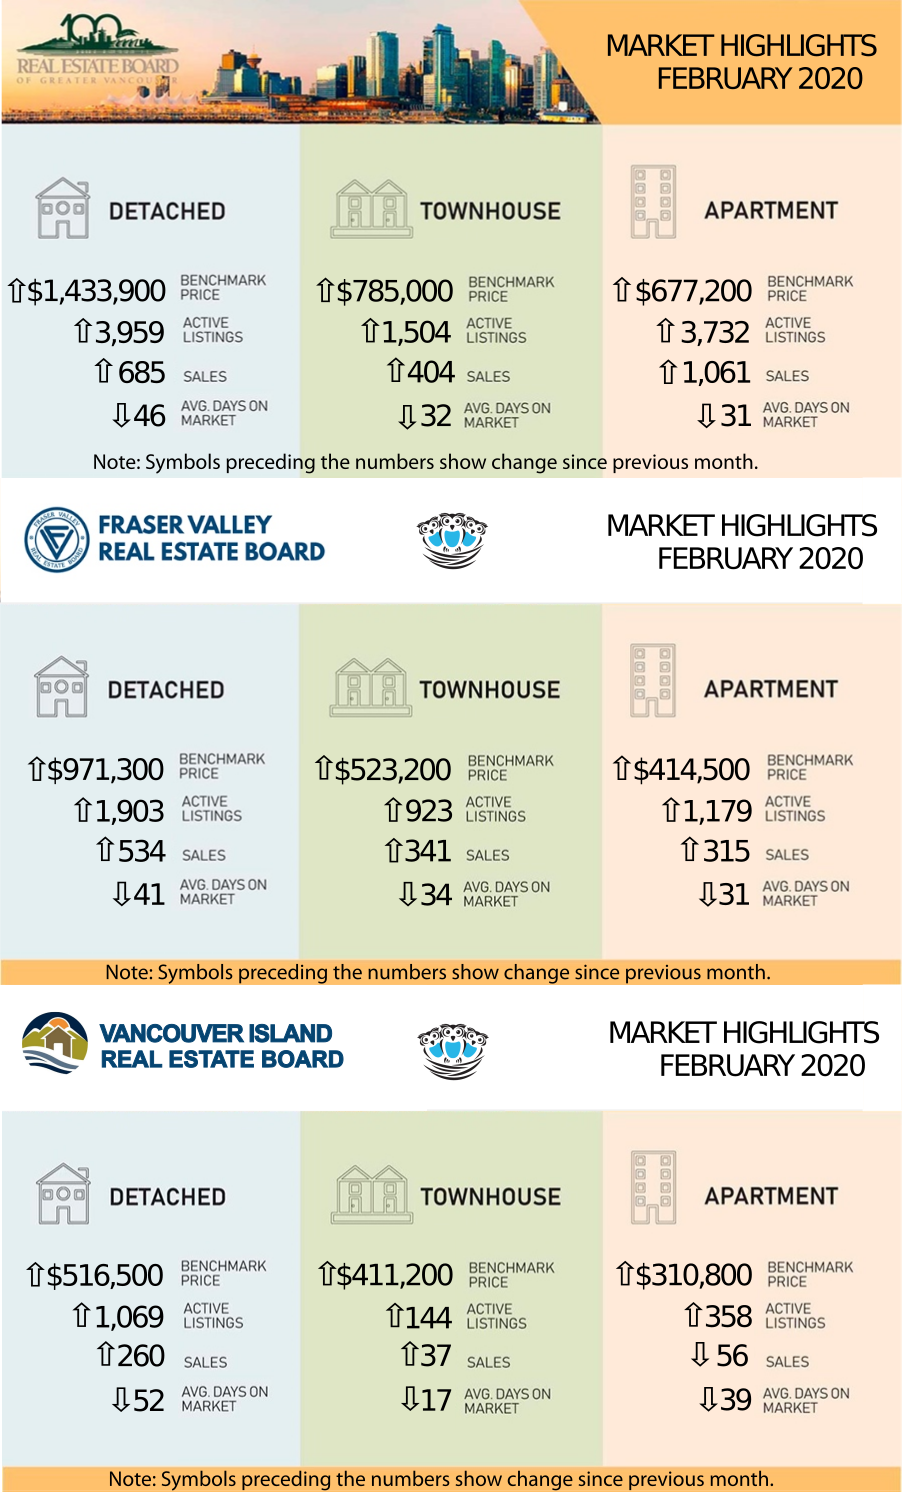
"There were 4,002 detached, attached and apartment homes newly listed for sale on the Multiple Listing Service® (MLS®) in Metro Vancouver in February 2020. This represents a 2.8 percent increase compared to the 3,892 homes listed in February 2019 and a 3.4 percent increase compared to January 2020 when 3,872 homes were listed.
The total number of homes currently listed for sale on the MLS® system in Metro Vancouver is 9,195, a 20.7 percent decrease compared to February 2019 (11,590) and a 6.7 percent increase compared to January 2020 (8,617)."
Sales of detached homes in February 2020 reached 685, a 52.9 percent increase from the 448 detached sales recorded in February 2019. Apartment sales were 1,061, a 39.8 percent increase compared to the 759 sales in February 2019. Attached home sales totaled 404, a 45.8 percent increase compared to the 277 sales in February 2019.”
From the Fraser Valley Board's February Statistics:
"There were 5,741 active listings available in the Fraser Valley at the end of February, an increase of 12 percent compared to January’s inventory and a decrease of 10 percent year-over-year. Additionally, 2,557 new listings were received by the Board for the month, a 15 percent increase compared to January’s intake of 2,216 new listings and a 15 percent decrease compared to February of last year.”
"Of the 1,352 total MLS® sales of residential and commercial combined in the Fraser Valley, 534 were single family detached homes, 341 were townhouses, and 315 were apartments."
From the Vancouver Island Real Estate Board's February Statistics:
"Last month, 260 single-family homes sold on the Multiple Listing Service® (MLS®) System compared to 174 in January and 227 one year ago. Apartment sales in February dropped by 19 percent year over year, while the number of townhouses sold decreased by 10 percent from one year ago. Inventory of single-family homes last month rose by eight per cent from one year ago (992 to 1,069). Active listings of apartments rose by 37 per cent (261 to 358) year over year, while townhouse inventory dropped by 11 percent (162 to 144)."
The Stats Centre Reports for the REBGV for February are available now on our website at this link under "BLOG AND STATS" . The Stats Centre Reports are automatically updated every month on our website as they become available. LINK
Here are the full statistic packages for Greater Vancouver, the Fraser Valley (which includes Surrey, North Surrey, South Surrey/White Rock, Cloverdale, Delta, Langley, Abbotsford, Chilliwack, and Mission), and Vancouver Island (which includes Campbell River, Comox, Duncan, Nanaimo, Parksville/Qualicum, and Port Alberni.)
Below is a link to a graph showing the rise in prices in the Lower Mainland just for resale properties (no new homes) over the last year. This link is live so it will update when the new statistics come in each month. LINK to live graph
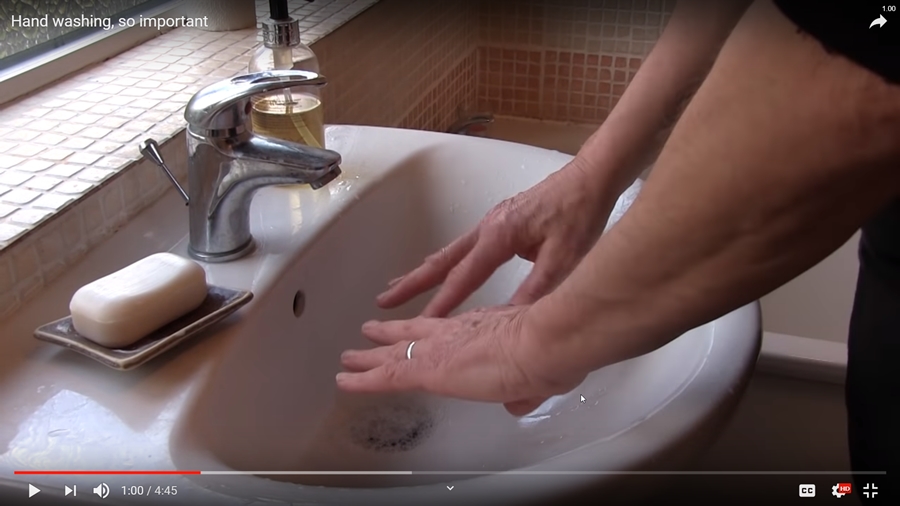
Featured Video of the Month (great for kids) - Dr John Campbell - "Hand Washing - So Important" Video: (Click on the image below for the video to open in a new window.)
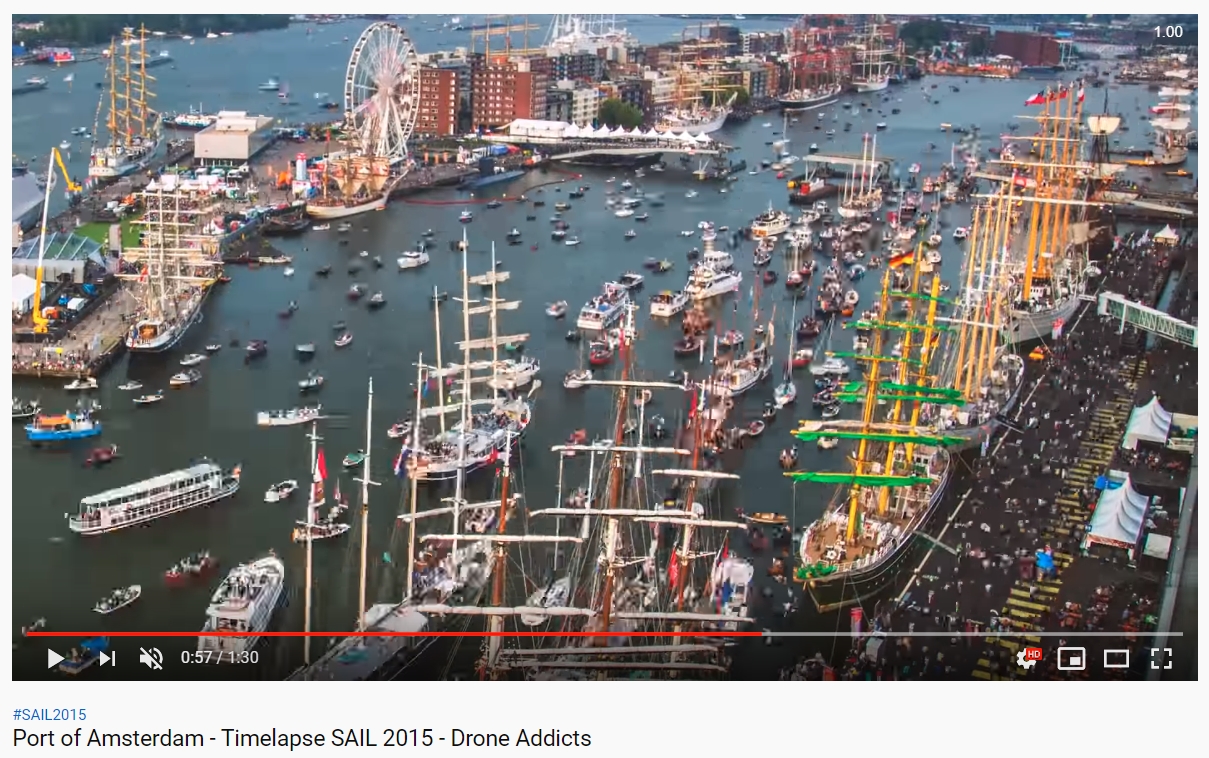
And drone footage from the "Sail Amsterdam 2015" event. SAIL Amsterdam is a quinquennial (every 5 years) maritime event in Amsterdam in the Netherlands. Tall ships from all over the world visit the city to moor in its eastern harbour.
(Click on the image below for the video to open in a new window.)
