December was a busy month for Real Estate in the Lower Mainland. For Greater Vancouver, sales were 88 percent higher than the previous year, the Fraser Valley had their "third best December since 2010" in sales, and the Vancouver Island Board saw a 40% increase in sales over the previous December. All three areas finished the year with their annual sales levels lower than the previous calendar year.
From the Greater Vancouver Real Estate Board's December Statistics:
"Sales of detached homes in December 2019 reached 599, a 72.1 percent increase from the 348 detached sales recorded in December 2018. The benchmark price for detached properties is $1,423,500. This represents a four percent decrease from December 2018, and a 0.6 percent increase compared to November 2019.
From the Fraser Valley Board's December Statistics:
"Single Family Detached: At $953,700, the Benchmark price for a single-family detached home in the Fraser Valley increased 0.2 percent compared to November 2019 and decreased 1.2 percent compared to December 2018.
From the Vancouver Island Real Estate Board's December Statistics:
"Sales of single-family homes in December increased by 40 percent from one year ago and were 24 percent lower than in November. Last month, 237 single-family homes sold on the Multiple Listing Service® (MLS®) System compared to 312 in November and 169 one year ago. Apartment sales in December rose by 68 percent year over year, while the number of townhouses sold dropped by 20 percent from one year ago. Annual sales of single-family homes in 2019 totalled 4,119, a nine percent drop from 2018’s 4,539 sales."
The Stats Centre Reports for the REBGV will be available in the next couple of days on our website at this link under "BLOG AND STATS". LINK
Here are the full statistic packages for Greater Vancouver, the Fraser Valley (which includes Surrey, North Surrey, South Surrey/White Rock, Cloverdale, Delta, Langley, Abbotsford, Chilliwack, and Mission), and Vancouver Island (which includes Campbell River, Comox, Duncan, Nanaimo, Parksville/Qualicum, and Port Alberni.)
Below is a link to a graph showing the rise in prices in the Lower Mainland just for resale properties (no new homes) over the last year. This link is live so it will update when the new statistics come in each month. LINK to live graph
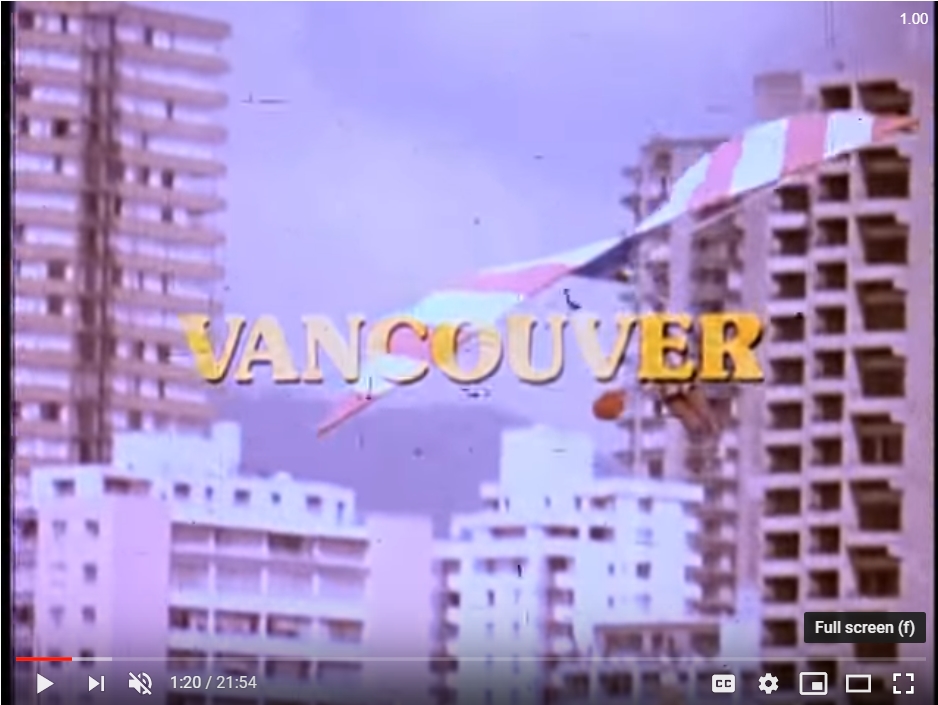
Featured Video of the Month - Vancouver Tourism Video from 1976: (Click on the image below for the video to open in a new window.)
